This documentation has been generated with the help of AI. Verify diagnostic conclusions against the original archive and the applicable KUKA documentation.
USER GUIDE / UPDATED 15 OCTOBER 2026
Using webQAC
Inspect KUKA diagnostic archives, correlate events, review configuration, and collect evidence for an investigation. This guide covers KSS 8.x KRCDiags and iiQKA.OS2 reports.
Screenshots show example archives, not recommended settings. Select an image to open it at full size. Use your browser's Print command for a paper or PDF copy.
Open an archive
Open webQAC in a current desktop browser. Serving the tool over HTTP is recommended; opening the local HTML file directly is also supported for many workflows.
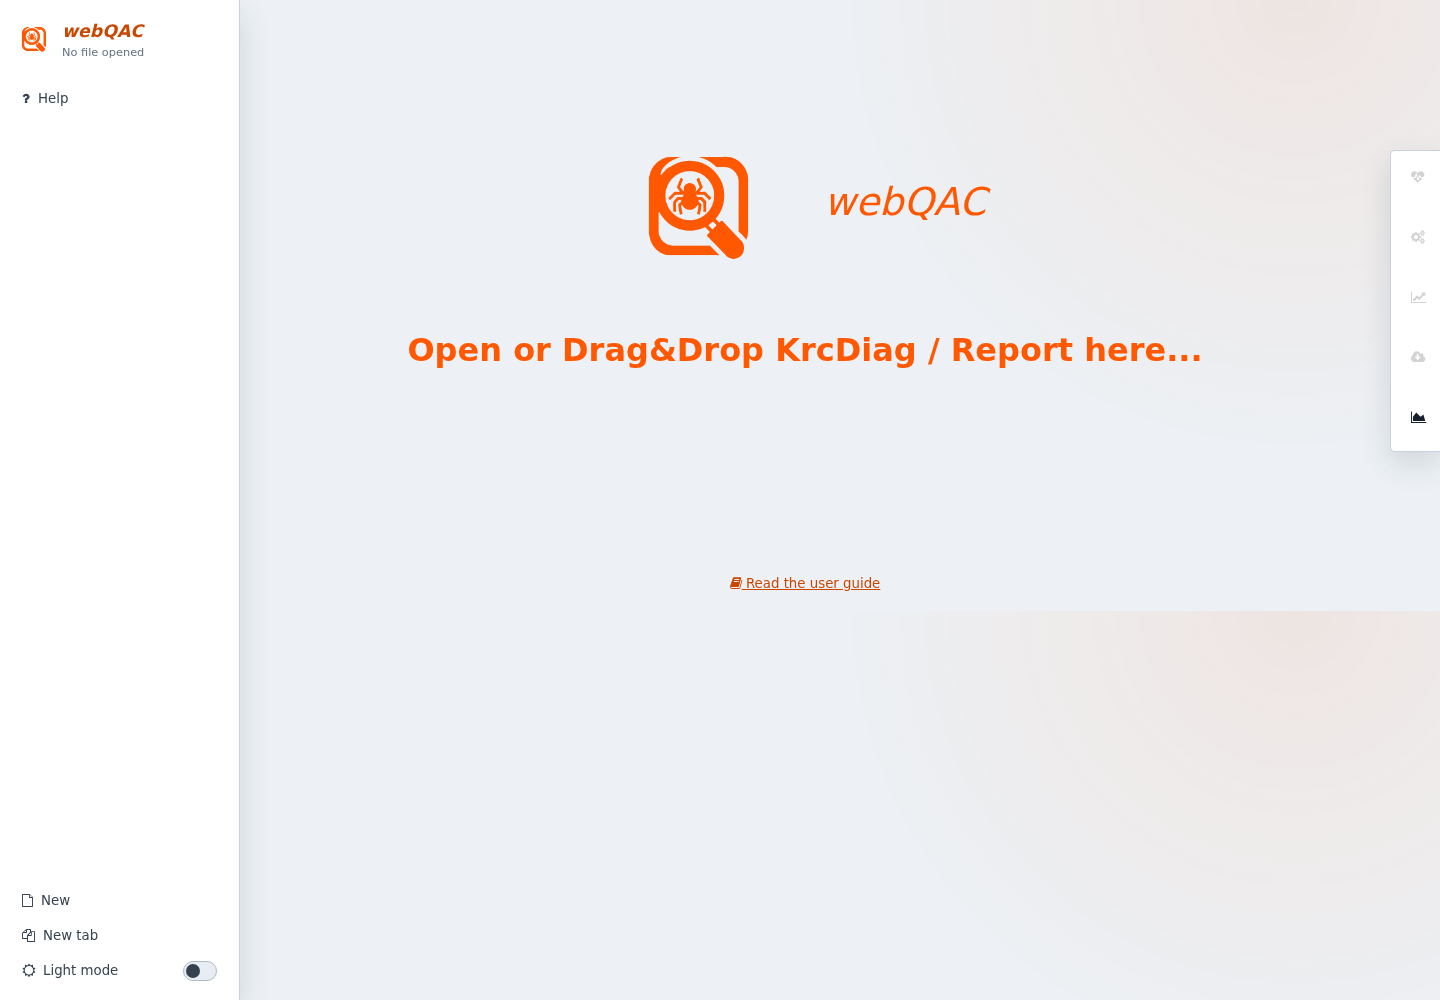
Drop a KRCDiag or Report ZIP onto the start surface, or click it to choose a file. With keyboard focus on the surface, press Enter or Space.
Wait for the import to finish. webQAC detects the archive type and opens the available diagnostic views.
Confirm the controller, robot, software release, and report context in Overview before investigating.
Keep the archive compressed: individual extracted files are not a replacement for the complete diagnostic ZIP. Some logfile and trace views parse their data only when first opened; wait for their loading indicator to finish.
The tool analyzes captured archive data, not a live controller. An absent value means the archive or parser did not supply it; it does not prove that a component or condition is absent.
Choose a complete diagnostic ZIP from the start page.
A practical investigation
Confirm context: check Overview for the correct controller and software. For OS2, check the instance information.
Triage: open Analysis and review errors and warnings. Open related sections from a finding when an action is provided.
Check resources: inspect Hardware for temperatures, disk space, and component information.
Establish the sequence: open Log history, narrow the time interval, and compare relevant sources. Select a record to inspect the complete message.
Verify evidence: inspect the primary log, Files / KRL, and the dedicated bus, motion, brake, or trace views.
Collect results: use the available project, trace, JSON, or motion downloads. Preserve the original archive alongside your conclusions.
Automatic findings are investigation aids, not a safety assessment or approval to change a robot. Apply controller changes only through the appropriate authorized engineering procedure.
Overview
KSS and iiQKA.OS2
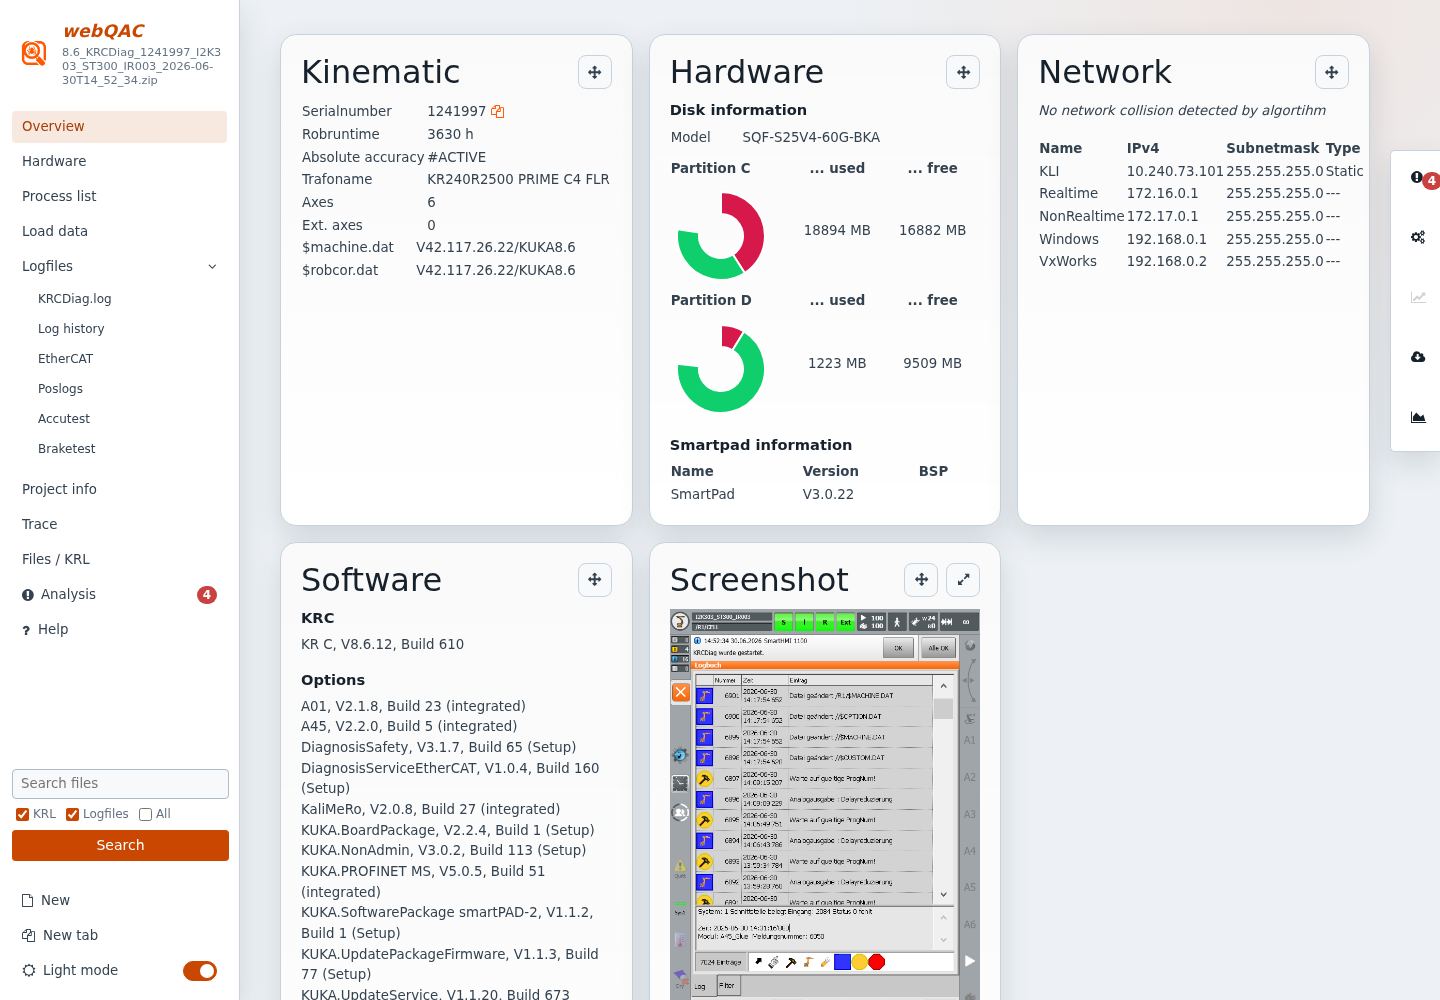
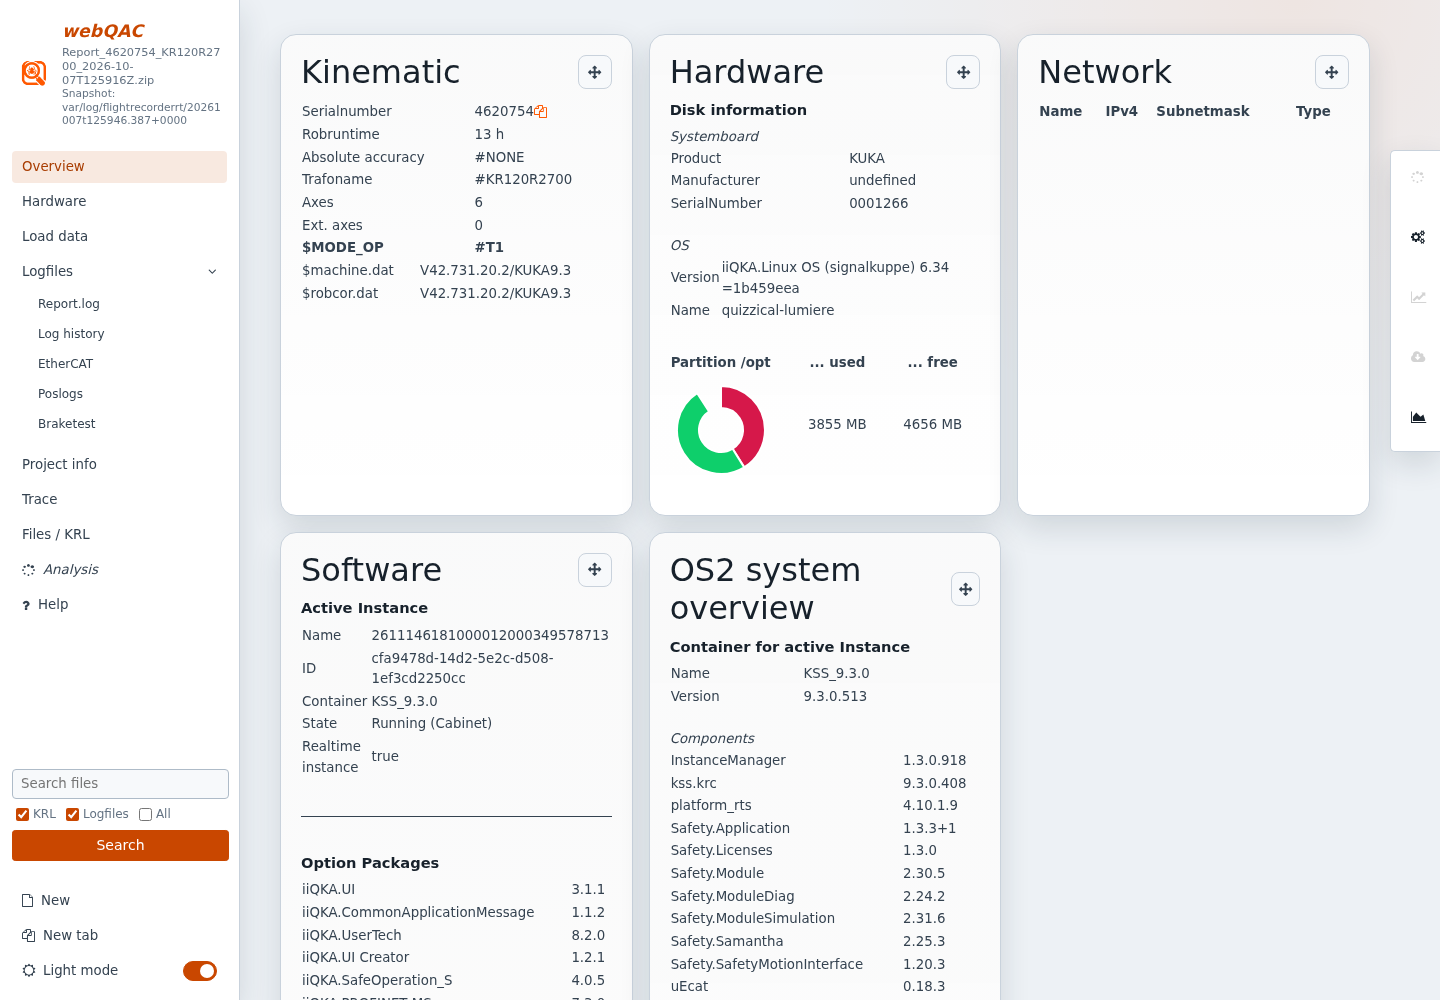
Start here to identify the controller, robot, installed software, and available hardware information. Depending on the archive, you will also see an HMI screenshot or OS2 instance information.
Check that the robot and controller match the system under investigation.
Record the software release and relevant installed options before checking compatibility.
Inspect storage summaries and follow up in Hardware when resources look constrained.
Drag a card by its arrow handle to change its position. Overview and Hardware retain their own card order in the current browser; this does not change archive data.
KSS Overview: confirm identity and captured configuration before investigating.OS2 Overview: report and instance context differ from a KSS capture.
Hardware
KSS and iiQKA.OS2; available fields depend on the archive
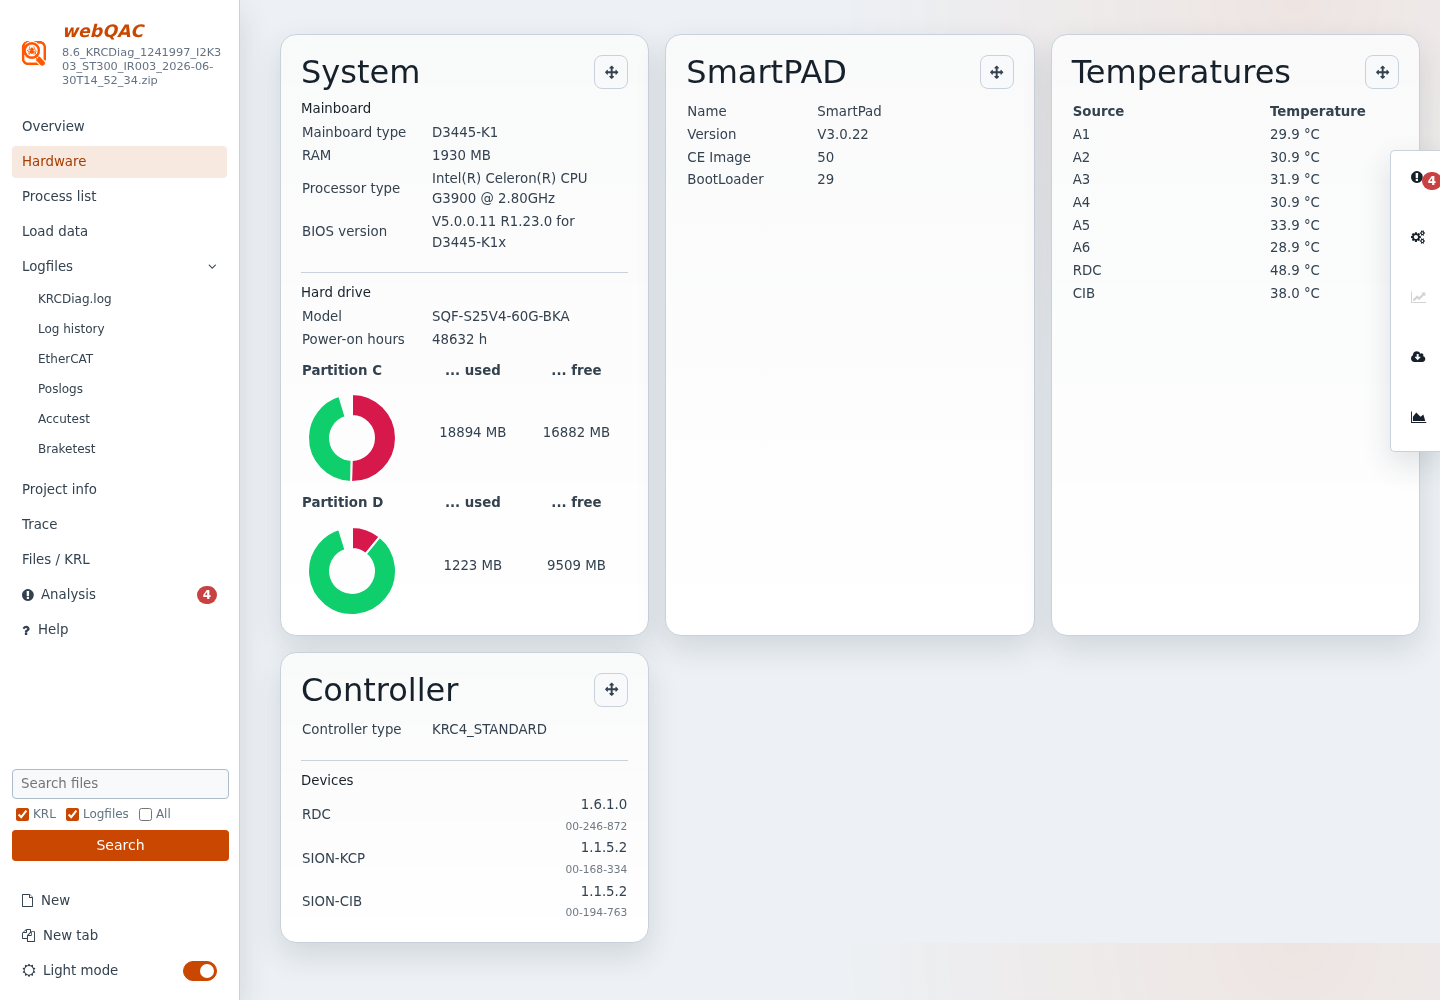
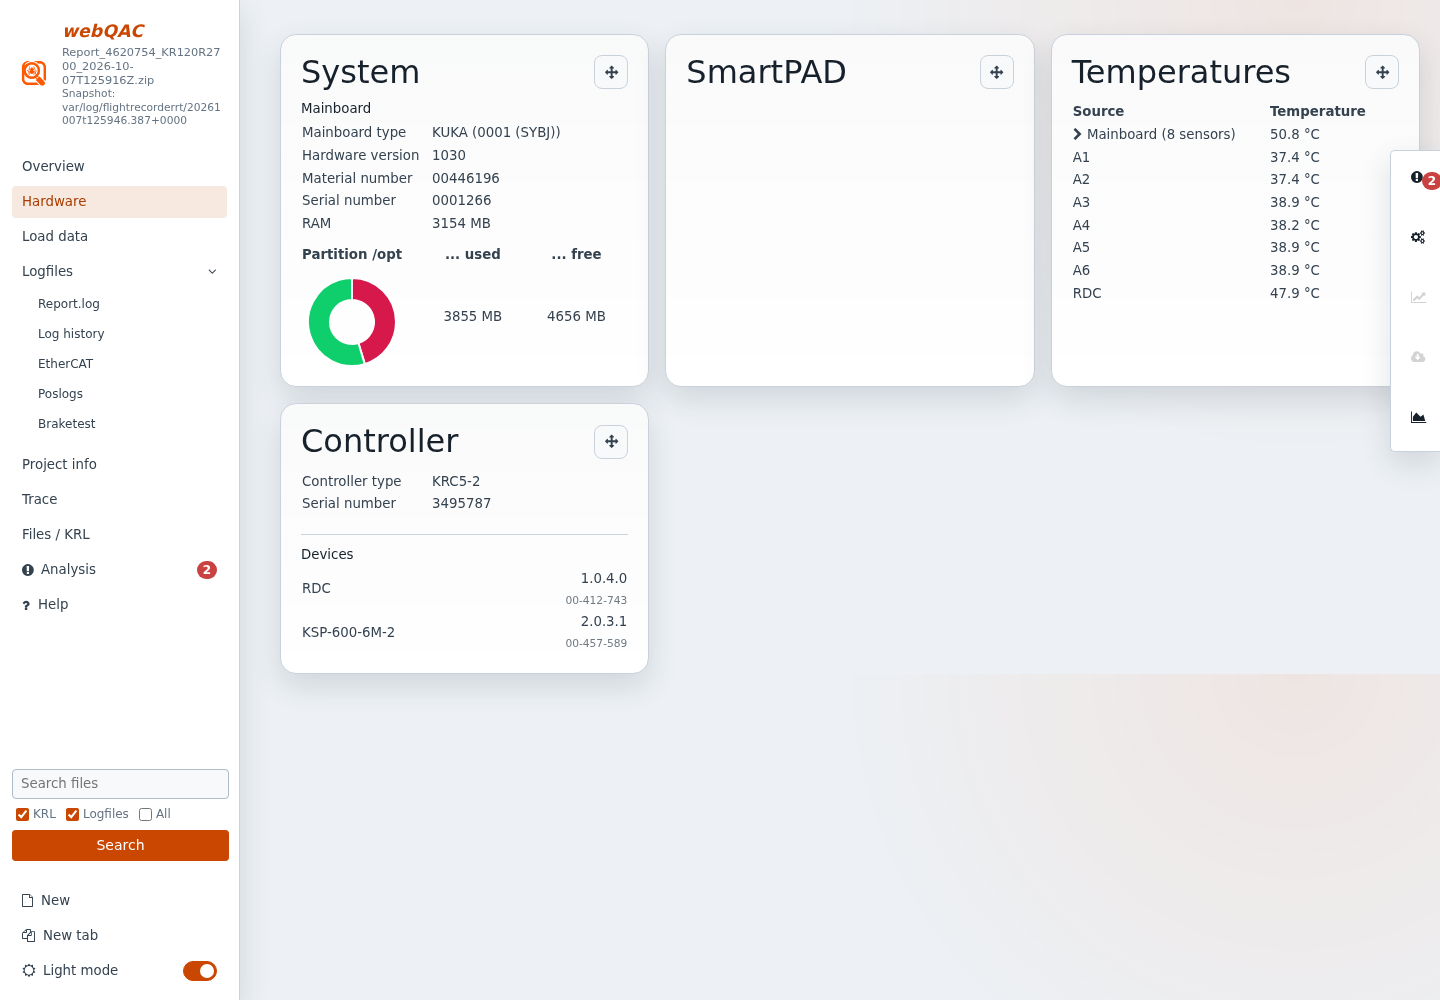
Inspect the System, SmartPAD, Temperatures, and Controller cards for board identification, memory, storage, firmware, and reported sensor values.
Check component identification and versions against the installed hardware.
Review partition capacity and free space; disk values are displayed in MB.
Review temperatures and expand grouped Mainboard readings when available. Red readings and thermometer icons flag values outside the applicable limits.
Temperatures are captured readings, not continuous monitoring. Missing or invalid readings are not a healthy-state indication. Consult Analysis for related temperature findings.
KSS hardware, storage, and reported temperatures.OS2 hardware information is determined by the captured report data.
Process list
KSS only
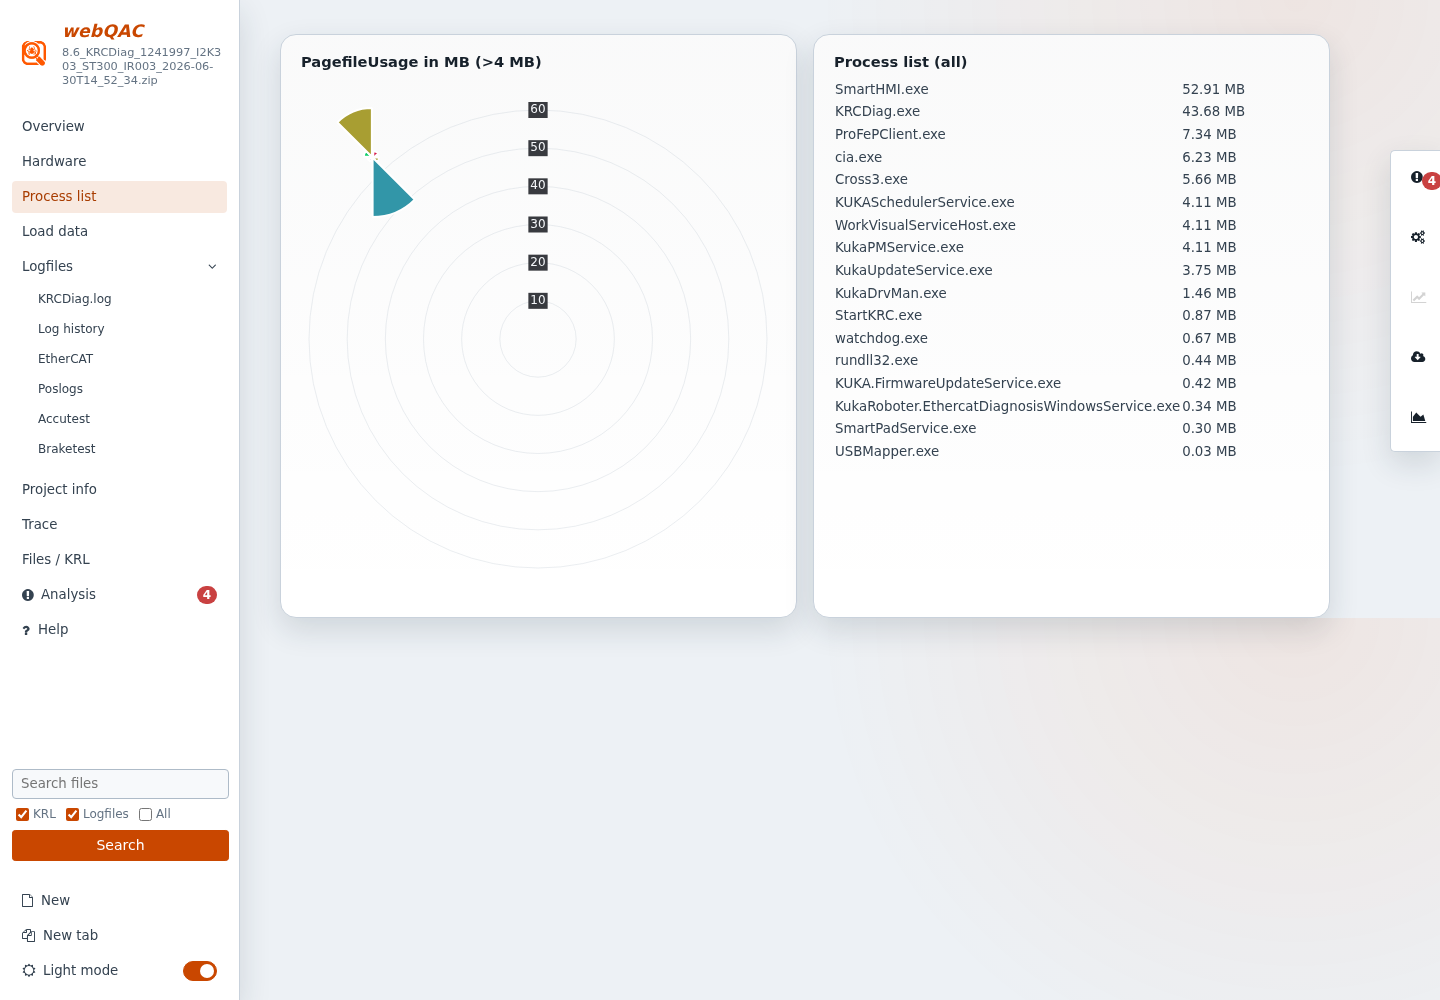
Review the Windows processes captured in the diagnostic report and their working-set memory usage, displayed in MB.
Look for unusually large consumers and compare them with Analysis findings and the original KRCDiag.log. A single snapshot does not establish a memory leak or sustained load; compare multiple diagnostic captures when necessary.
Process memory is a diagnostic snapshot, not a continuous performance trace.
Load data
KSS and iiQKA.OS2
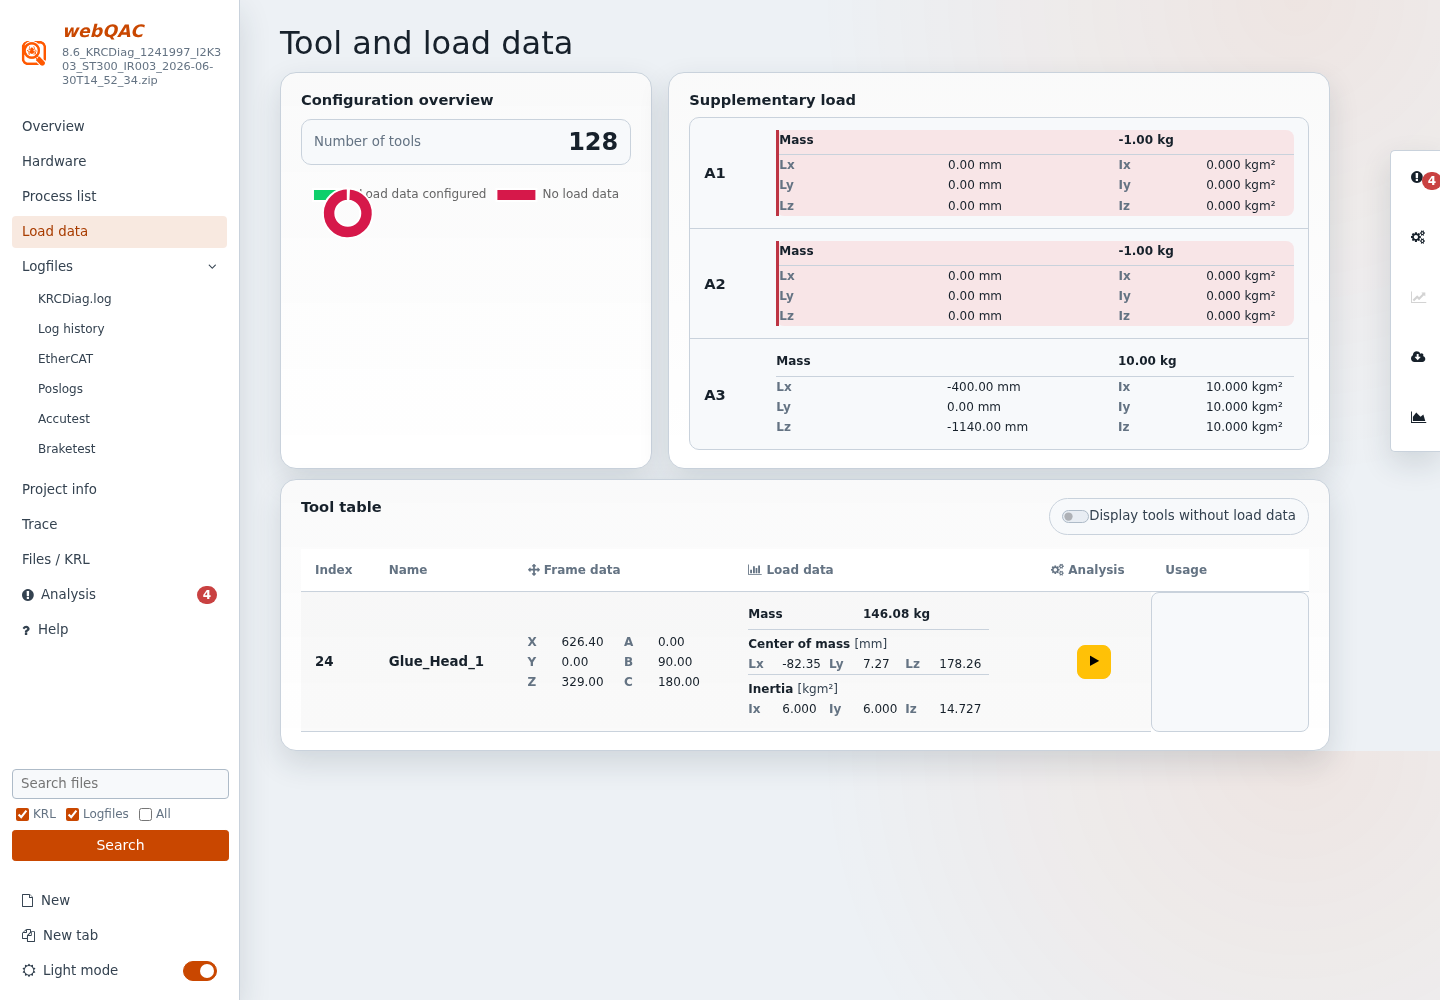
Inspect configured tools, frames, load properties, and their recorded usage. Tool rows associate each tool index with its name and separate mass, center of mass, and inertia.
Find the tool index used by the relevant program.
Check the TCP/frame and load properties, paying attention to the displayed units.
Use the Usage entries to identify related modules, then inspect those modules in Files / KRL.
Use the available KUKA.Load action when a separate load assessment is needed.
Displayed values are shortened for readability; the JSON data model retains parsed precision. Configuration presence and recorded usage do not prove that a tool is physically installed or correctly calibrated.
Enable Display tools without load data to include tools whose load fields are empty.
Inspect frame and load properties for the relevant tool index.
KRCDiag / Report log
KRCDiag.log for KSS; Report.log for iiQKA.OS2
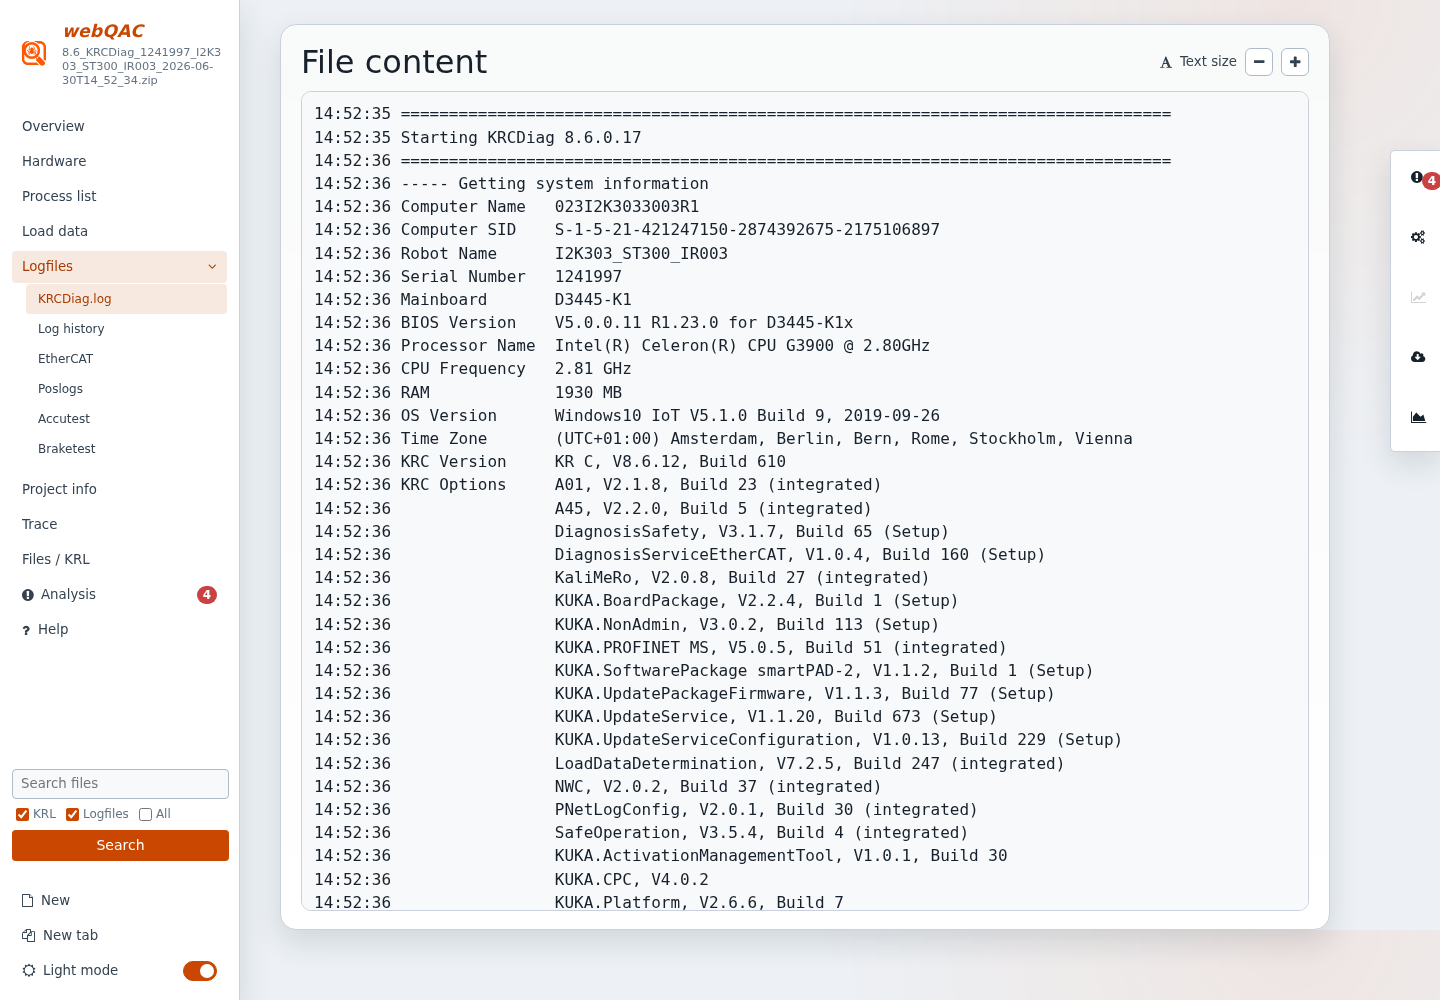
Open the first entry under Logfiles to read the archive's primary diagnostic report in the text viewer. Use it to verify the source behind a summary or locate report details that have no dedicated card.
The file tree is hidden for this dedicated view. Return to Files / KRL to browse the archive normally. Use the viewer's Find and text-size controls to inspect long reports.
Verify summaries against the primary diagnostic report.
Log history
KSS and iiQKA.OS2
Correlate supported timestamped logs in one chronological list. Sources can include System, Logbook, Cross, platform services, SmartHMI, Linux services, Flight Recorder, and supported Windows event logs.
Wait for the first history load to complete and check the summary for read errors.
Open the filter icon in the Source or Severity column header to choose multiple values. Select all and None affect only that column. A colored icon indicates an active filter; no selected values means no rows. On narrow screens, scroll the table horizontally to reach the headers.
Type directly in the Message column header to filter the displayed message text. Spaces mean AND: motor fault -reset requires both words but excludes messages containing reset. Quotes require complete words or phrases: "motor fault" -reset matches Motor fault! (also with extra spaces) but not motor faulty. Put - before a quoted phrase to exclude only that whole phrase. Matching ignores case; press Escape to clear the field. File paths and metadata are not included.
Open the filter icon in the Time column header to see the time slider. Use its activity marks to locate periods with records. Set an interval with the two handles or UTC From/To fields; drag the selection to move it. Clear time range removes only the time restriction.
Press Ctrl+F or Cmd+F to highlight matches among the rows left by the filters without hiding more rows. The Find bar shows the current/total count; use its arrows or Enter/Shift+Enter to move between matches. Closing the popup or pressing Escape clears only the highlighting search.
Select a row to read its full message, timestamp, and source file in the detail pane. Use ArrowUp/ArrowDown to inspect adjacent records. Changing filters keeps the selected row in view while it still matches; filtering it out clears the selection.
Choose Export filtered logs to download all records matching the current Source, Severity, Time, and Message filters as a timestamped filteredLogs.txt file. Each line contains Time, Severity, Module, and Message separated by semicolons and tabs; multiline messages are flattened. File locations and expanded details are omitted. Find highlighting does not limit the export. The button is unavailable when no records match.
Drag a column-header edge to resize its column. Inside the Source filter, Message language appears beneath Logbook; it changes supported KUKA message translations and is remembered in this browser. Missing translations retain raw keys; changing language does not translate arbitrary log text.
Cross entries show decoded operations where recognized; their details preserve raw records. Windows-event details retain payload and metadata even when a KUKA message is translated.
KSS Systemlog dates can be inferred from filenames; controller clock offsets and time zones are not corrected. Treat cross-source timing as evidence to verify, not guaranteed synchronization. OS2 history uses the selected report snapshot and matching Flight Recorder service logs, not every snapshot in the ZIP.
EtherCAT
KSS and iiQKA.OS2
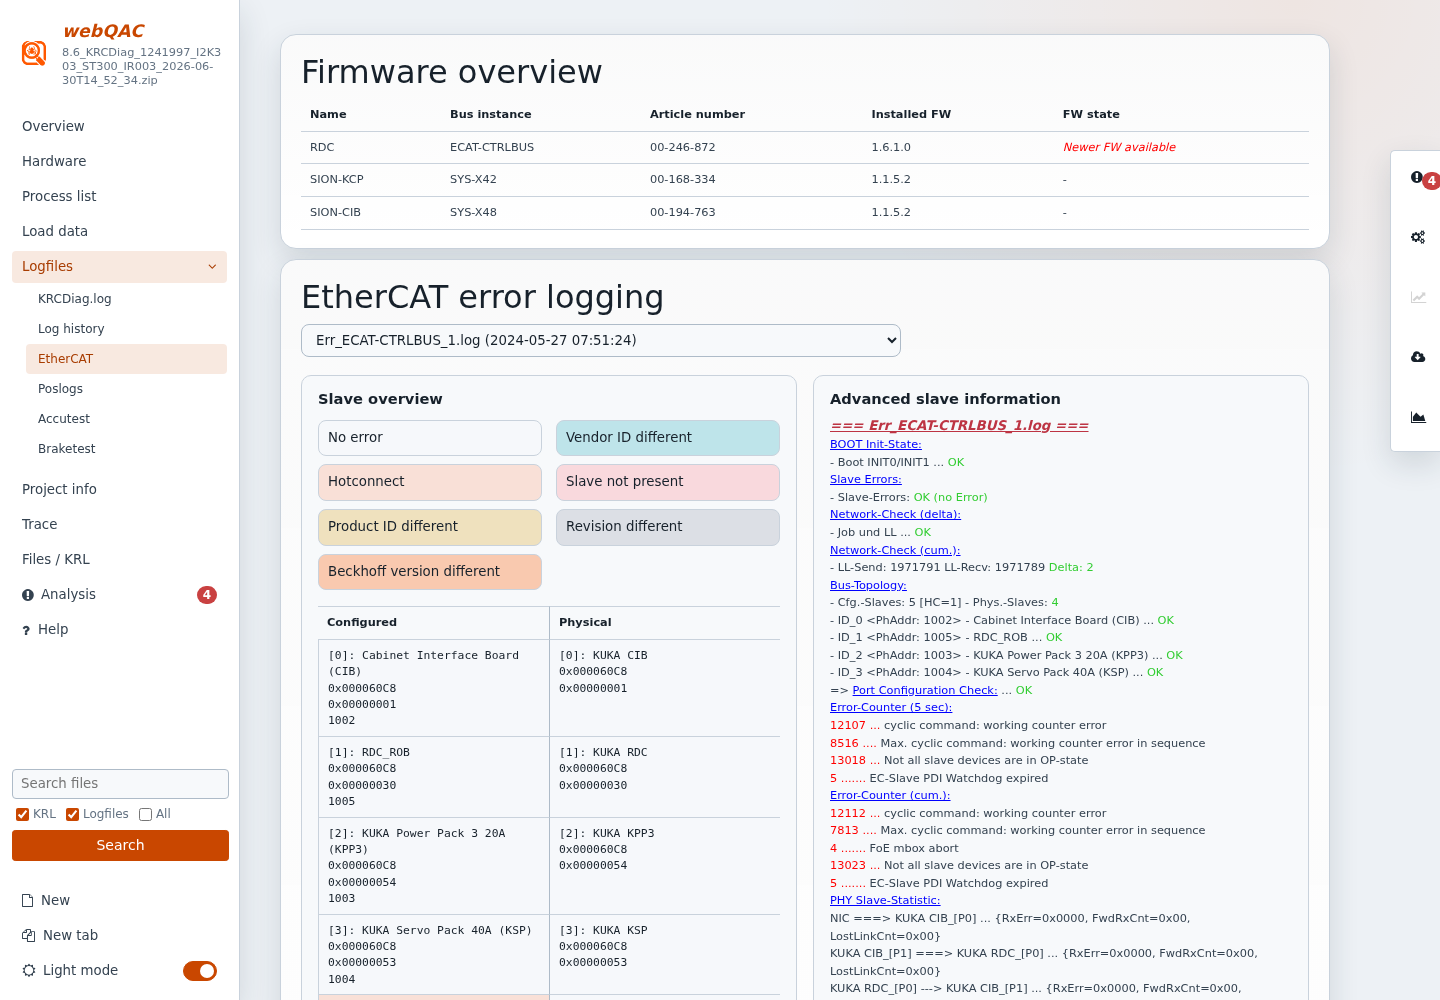
Review discovered bus devices, firmware information, and EtherCAT diagnostic errors. Open the view and wait for its first diagnostic load.
Identify the affected device or slave, inspect the error details, and correlate the incident with Log history. Firmware summaries describe captured versions; verify release-specific compatibility before recommending an update.
Review the device inventory alongside available bus diagnostics.
Poslogs
KSS and iiQKA.OS2, when recordings are present
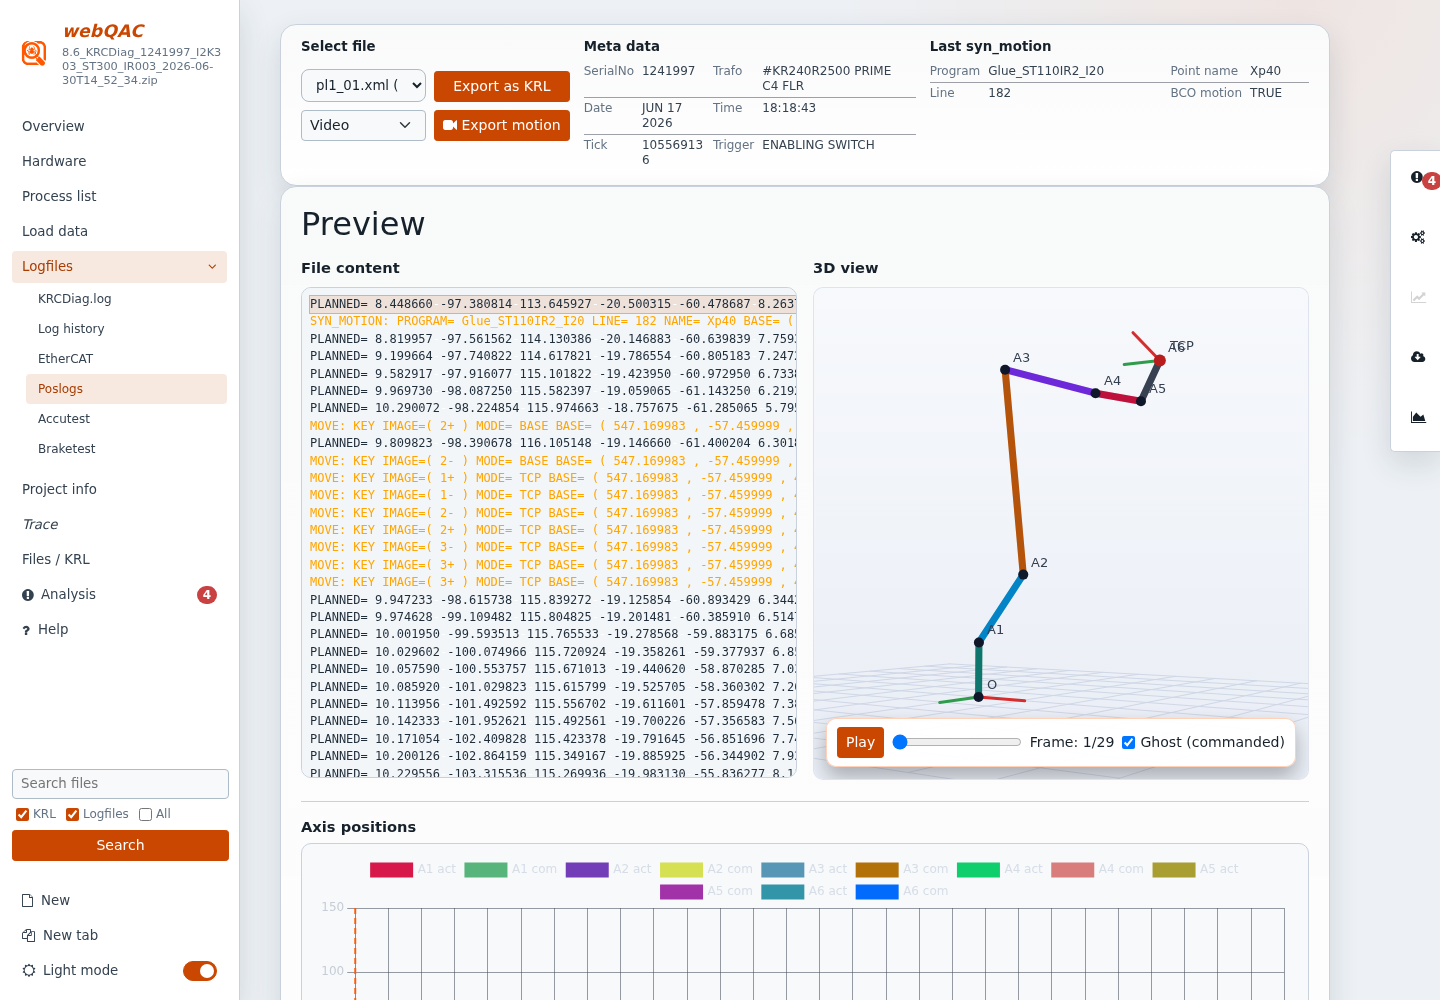
Inspect recorded positions through metadata, plotted signals, and the 3D motion view.
Select a recording from the Poslogs list.
Check its metadata and chart before interpreting the motion.
Use Play and the frame slider to inspect the sequence. The ghost and manual-axis controls support visual comparison; manual changes affect the visualization, not the archive or robot.
For a motion export, select Video or GIF and choose Export motion. Video format depends on browser encoder support.
Use the available KRL export when needed for further inspection. A reconstructed visualization or exported program is not a validated robot execution path; verify kinematics, frames, and configuration independently.
Inspect a selected recording frame and compare source data with the motion visualization.
Accutest
KSS only, when test history is present
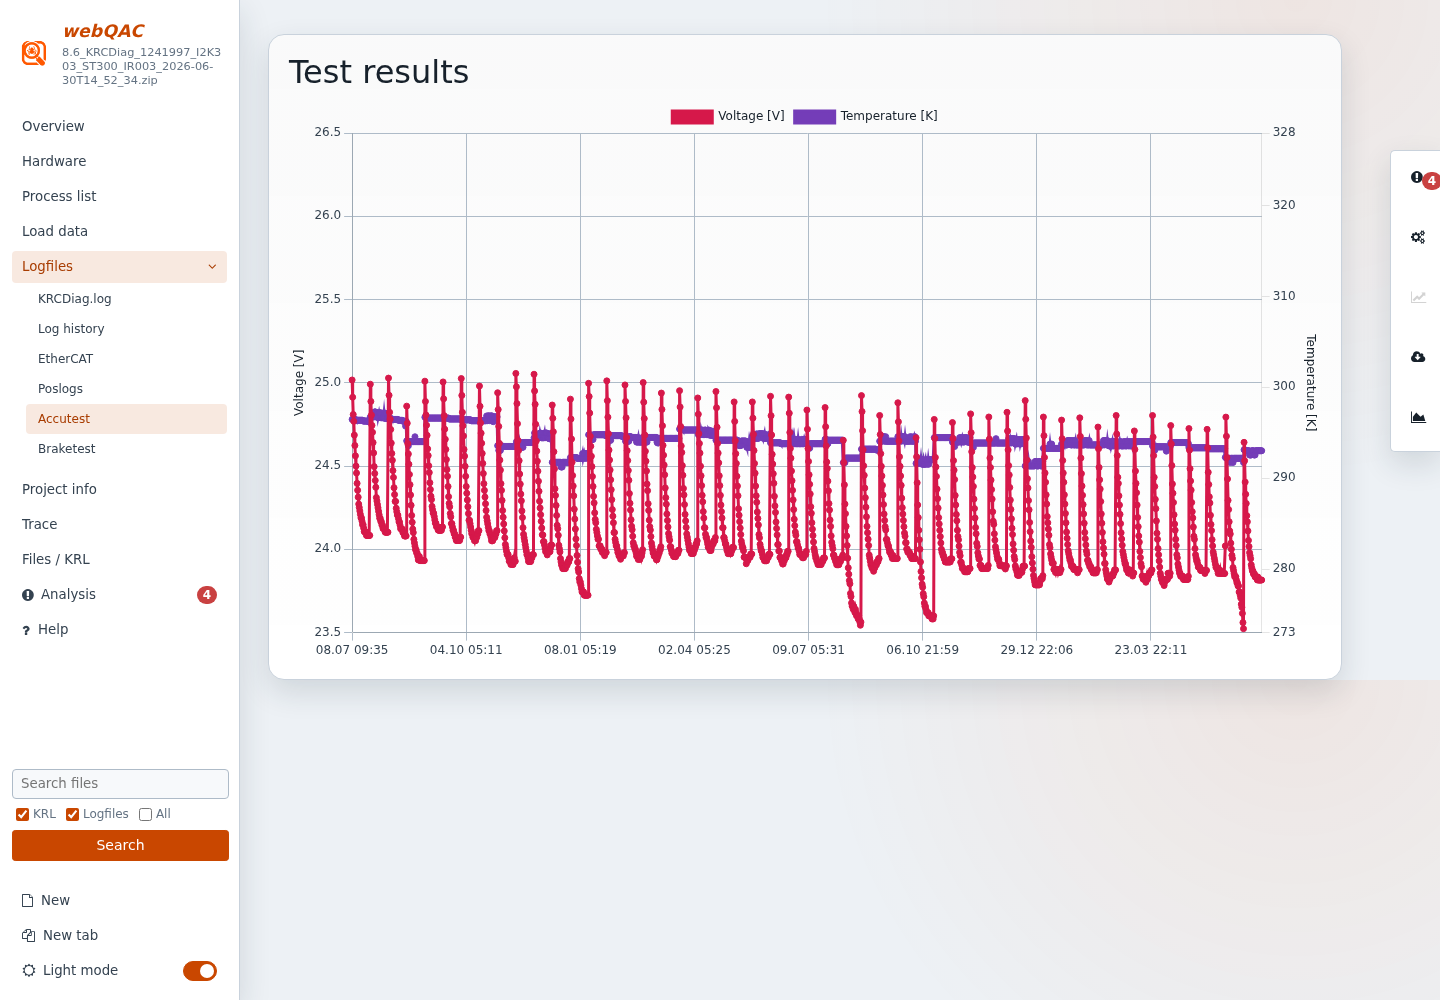
Inspect the recorded battery-test voltage and temperature curves. Compare the available history for changes over time and check the underlying diagnostic context before concluding that a battery needs replacement.
This view displays historical tests; opening it does not initiate a battery test on the controller.
Read the chart units carefully: voltage is shown in volts and this test's temperature series is shown in kelvin.
Captured battery-test history with separate voltage and temperature axes.
Braketest
KSS and iiQKA.OS2, when results are present
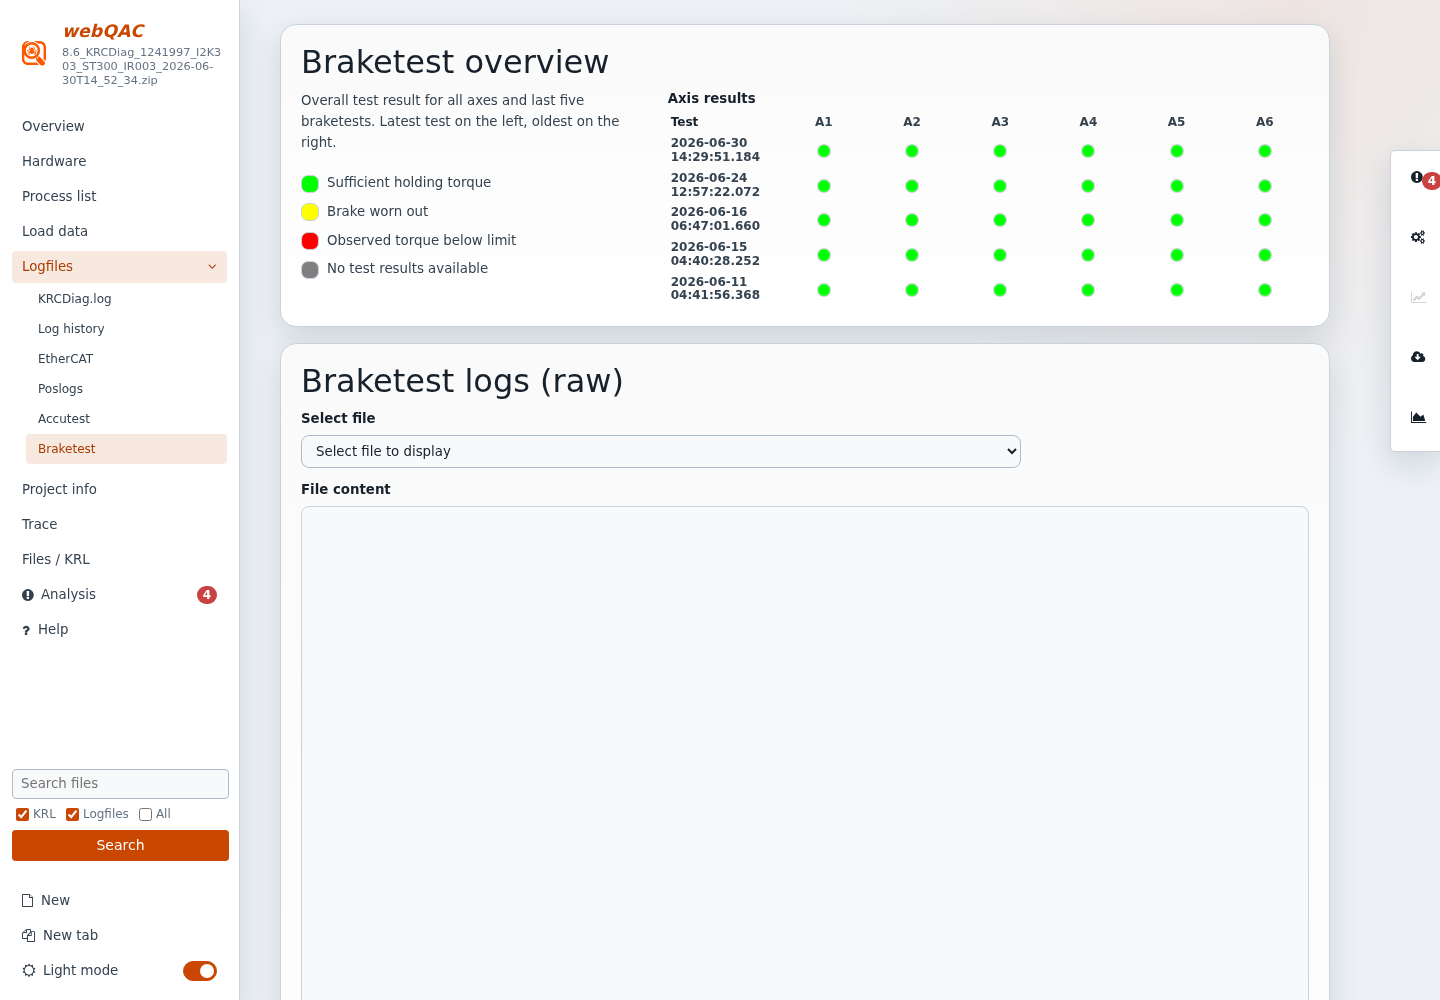
Inspect captured brake-test results. Switch between basic and expert views to move from the result summary to more detailed source information.
Check the test context and affected axes, and use the source text to verify unexpected results. Viewing a report does not perform a brake test or certify brake safety.
Interpret axis results using the view's legend and verify the underlying test records.
Project info
KSS and iiQKA.OS2; project contents vary
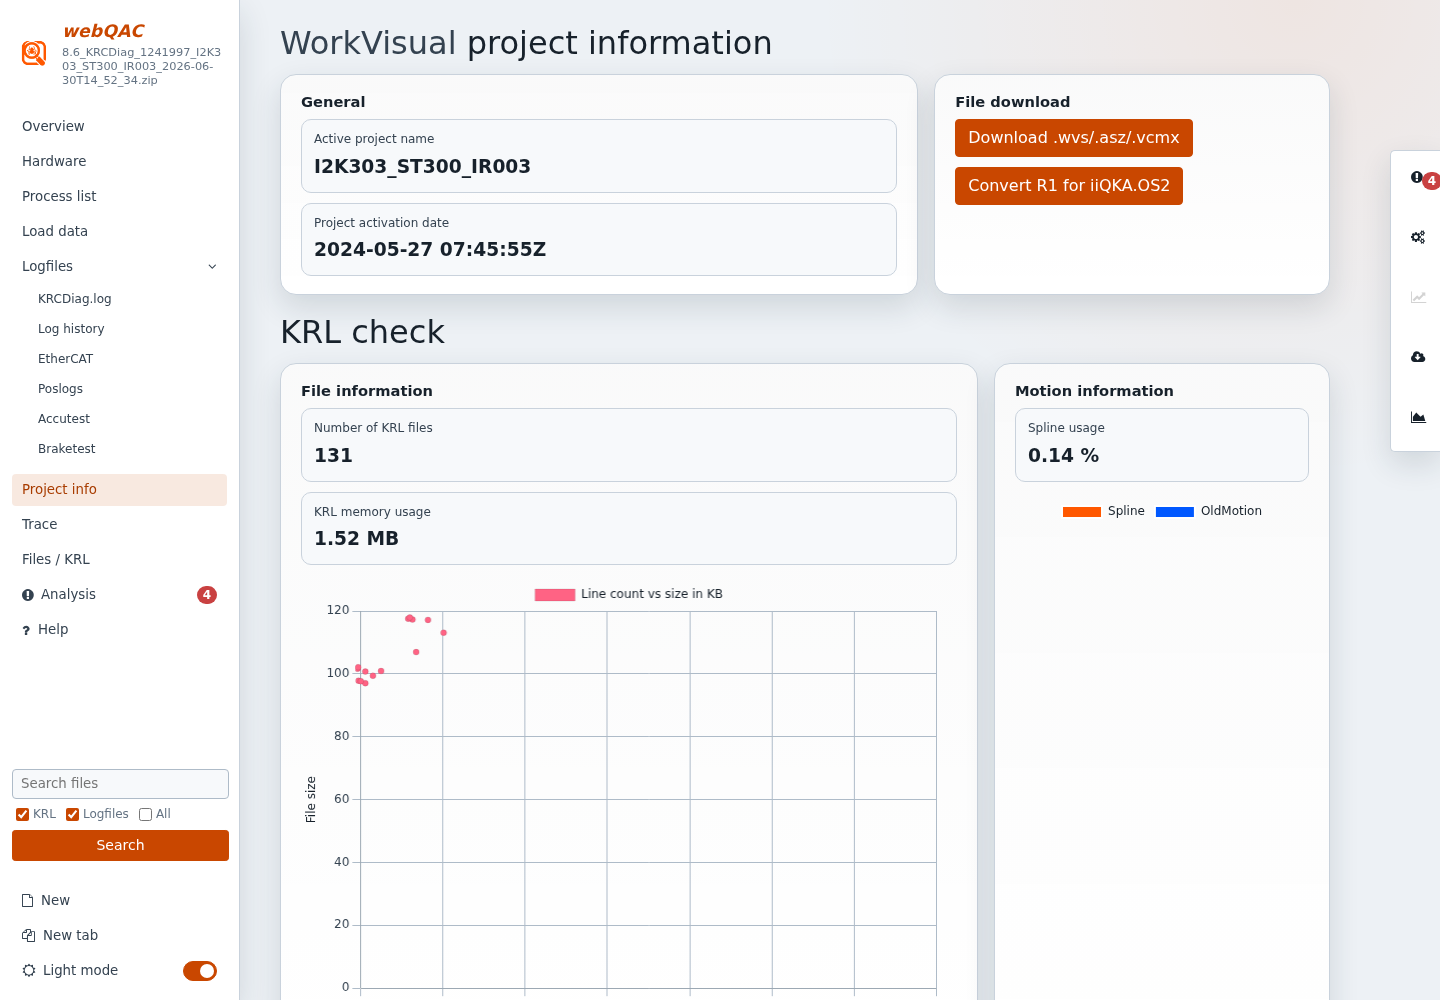
Review the available WorkVisual/project information and KRL checks. Use the project download when the ZIP contains an exportable project.
Compare the project information with the controller software and options in Overview. A project extracted from a diagnostic archive is evidence of the captured configuration, not confirmation that a local engineering project is current.
Project details provide context for configuration and KRL investigations.
Trace
KSS and iiQKA.OS2, depending on captured trace contents
Inspect available trace recordings and supported modules, including KrcIpo and NextGenDrive data.
Select a recording, then choose an available module such as KrcIpo or NextGenDrive.
Choose the available signals in the channel selector and inspect the plot.
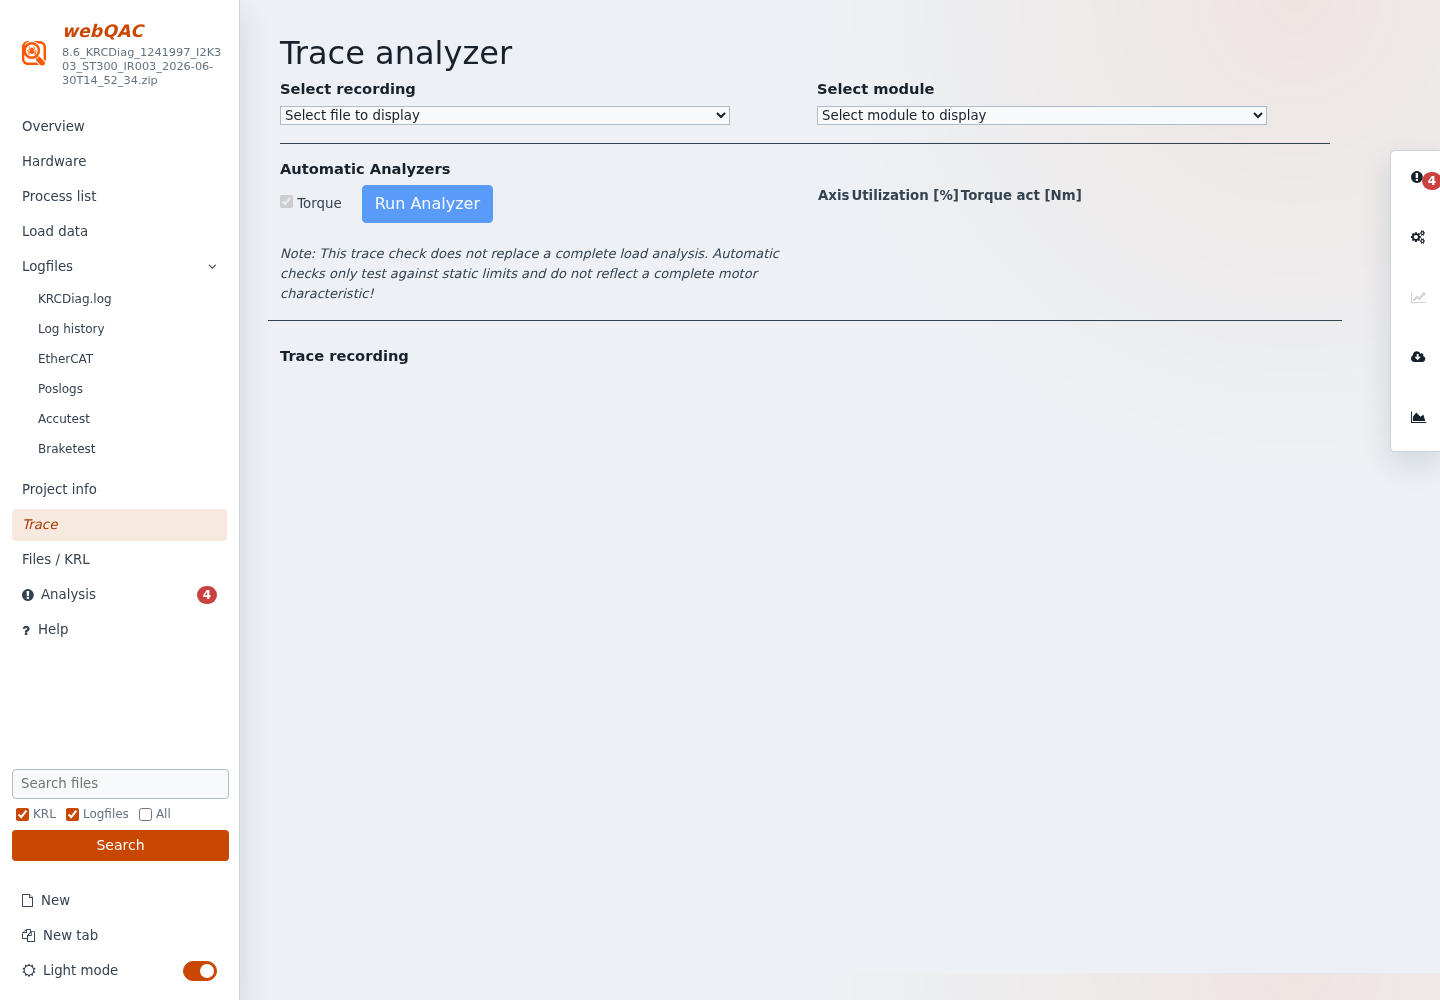
When enabled, choose Run Analyzer to evaluate the supported torque check and inspect the on-screen results.
Use Trace Download to save the captured trace files from the archive for further inspection; it does not export the on-screen analyzer results.
The example below shows an archive without a supported trace recording: the recording and module selectors cannot be used, and there is no plot to inspect. With a supported recording, selecting it makes its available modules and signals accessible. If your view looks like the example, check whether the archive contains a supported recording before trying the analyzer. Trace plots show captured signals, not live measurements.
The automatic torque check uses static limits and does not replace a complete load analysis or the motor characteristic.
No supported recording in this archive: the empty selectors and plot are expected, not an analyzer result.
Files / KRL
KSS and iiQKA.OS2
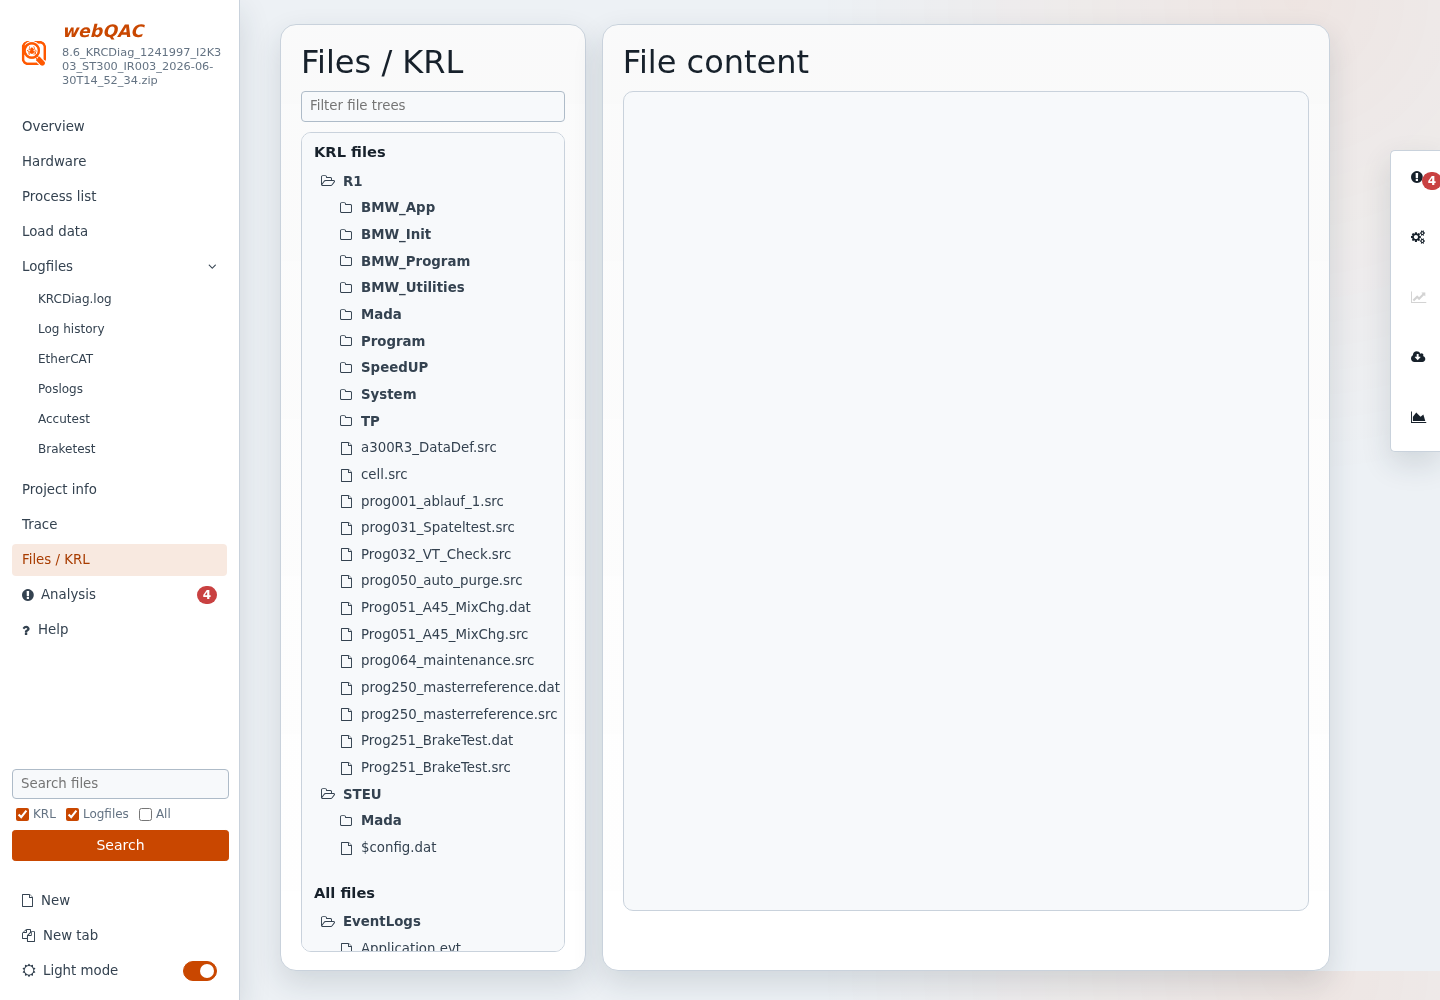
Browse the archive file system or the focused KRL tree and select a readable file to preview it. Supported KRL, XML, JSON, and INI content receives syntax highlighting.
Expand the appropriate directory and select the source or configuration file.
Use the viewer's Find control to locate relevant text.
Use the plus/minus controls to adjust that viewer's text size independently.
Use this view to verify configuration references and program usage found elsewhere. The preview is read-only; it does not modify the archive or controller. Binary and unsupported files may not have a useful text preview.
Navigate the KRL or full archive tree, then select a readable file.
Analysis
KSS and iiQKA.OS2; checks depend on available evidence
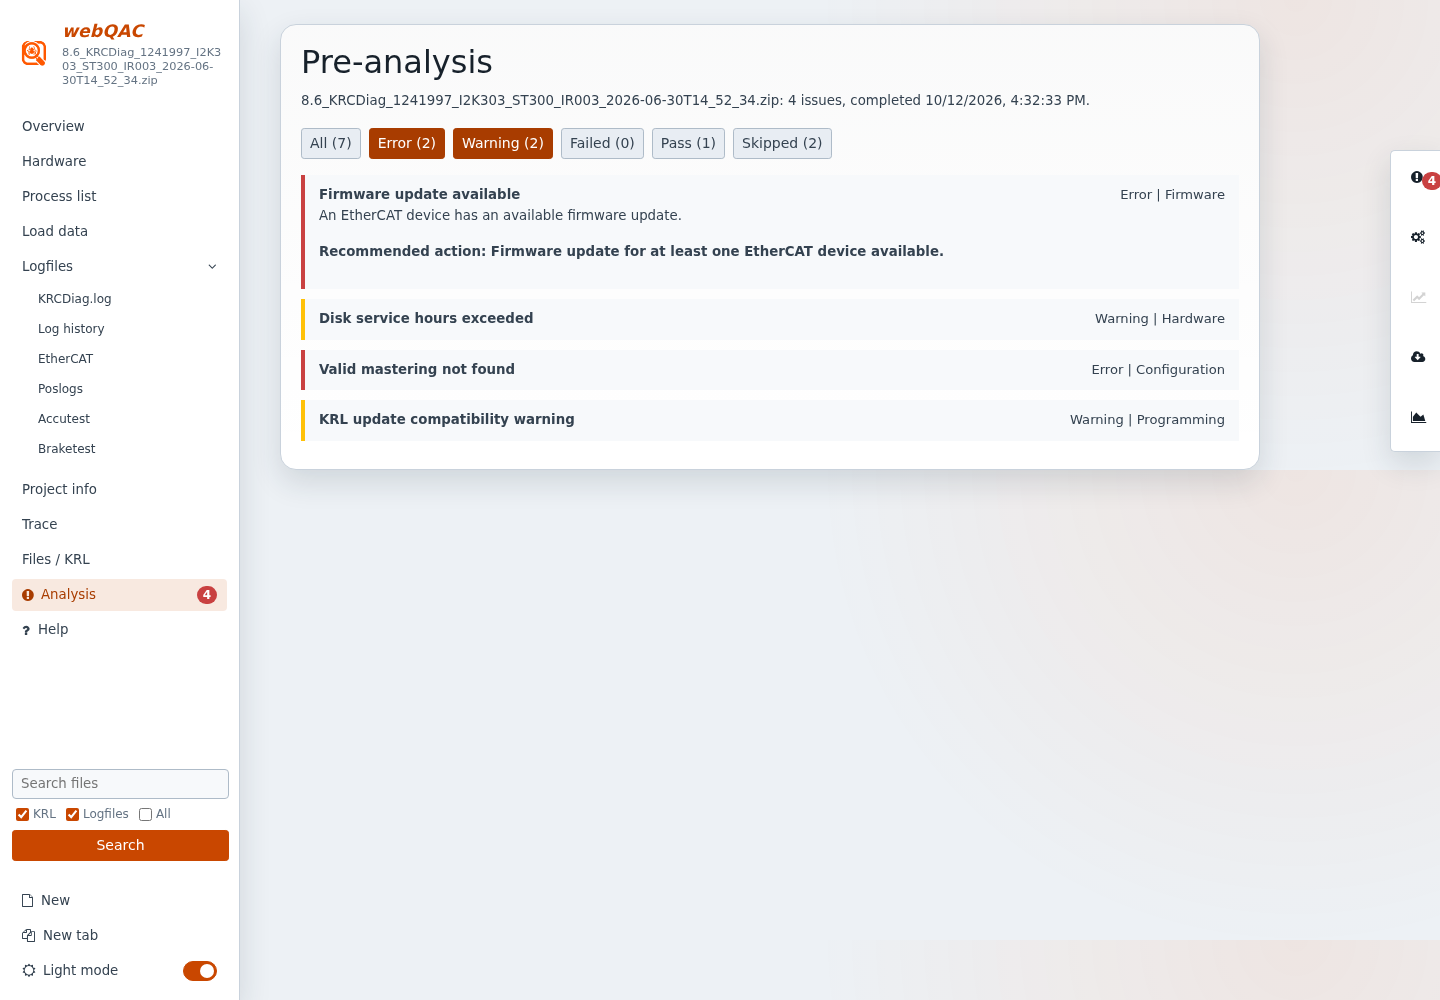
Review automatic diagnostic findings and recommended follow-up actions. The navigation badge summarizes findings from the registered checks.
Analysis checks Windows System events for unclean restarts without loading the full Log history. Kernel-Power event 41 does not identify the cause. Its possible mitigations are listed separately, including checking batteries and network connections; KSS 8.7 also suggests considering the system board. Review the event record in Log history.
Open Analysis after the initial import and review the highest-severity findings first.
Use the available filters to narrow the findings, then expand an item to inspect its evidence and recommendation.
Follow actions such as Open load data or Open process list to inspect the related configuration.
Open relevant deferred diagnostic views and return to Analysis: additional parsed evidence can update the findings.
No findings does not mean that the robot is fault-free. Analysis checks selected conditions in the data it can parse; incomplete captures, unsupported formats, and conditions outside those checks require independent investigation.
Expand a finding to review its recommendation and any related-view action.
Search files and results
KSS and iiQKA.OS2
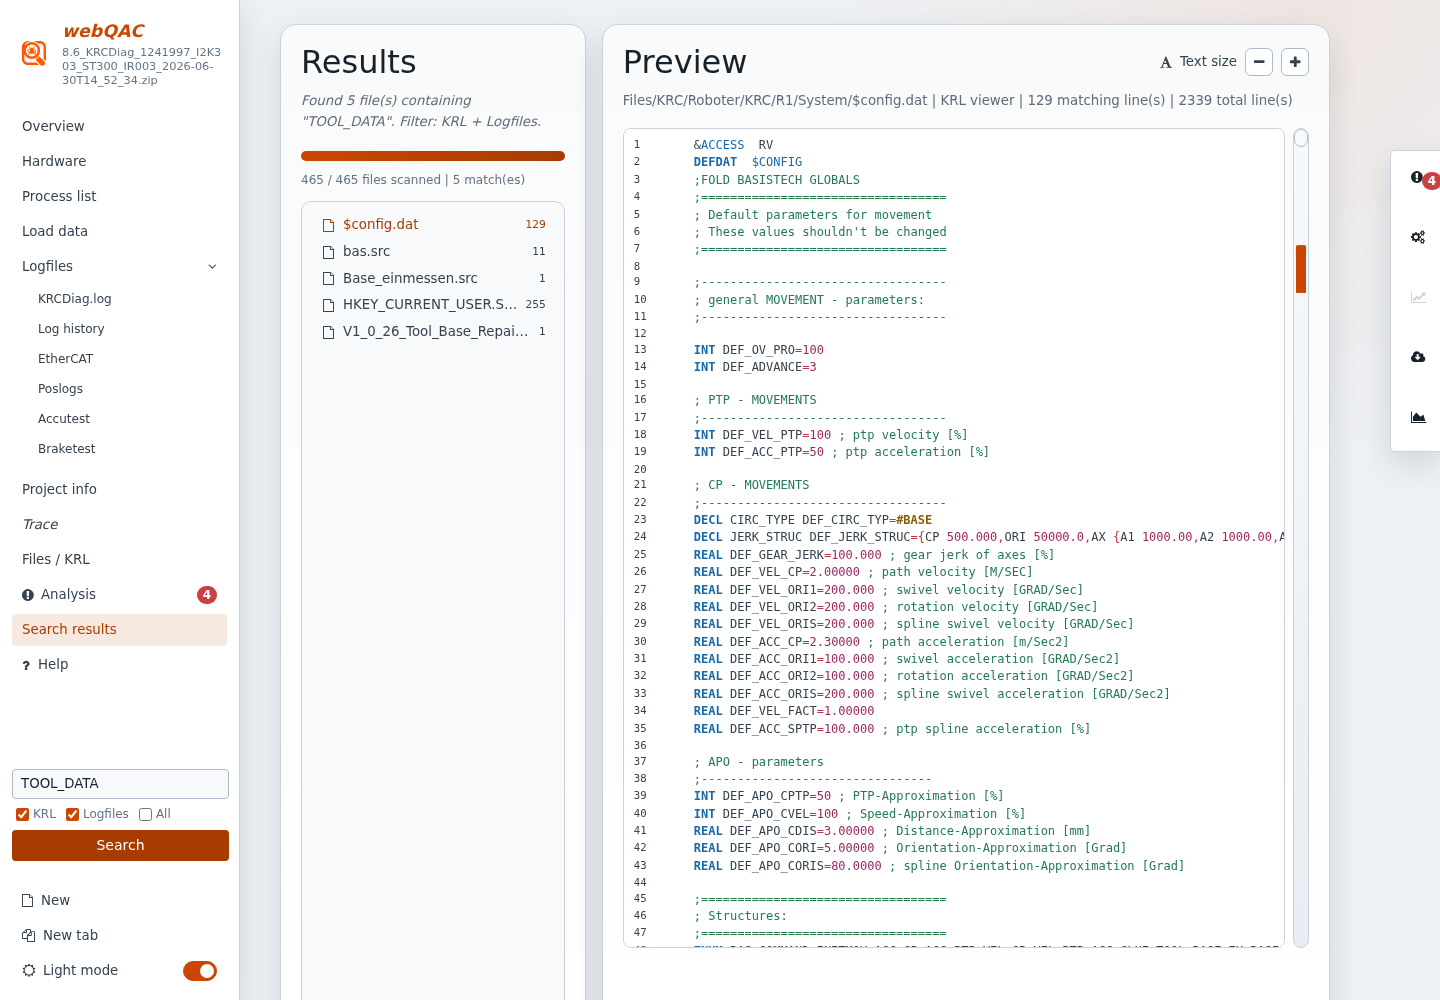
Enter a query in the sidebar's Search files control.
Choose KRL, Logfiles, or All as the search scope, then run the search.
Wait for scanning to finish and open Search results.
Select a matching file to inspect its full preview and highlighted matches.
Use archive-wide search when you know a variable, configuration key, or message fragment but not its file. All includes readable archive content; binary files are skipped. This search is separate from Log history's row highlighting and does not inherit its source, severity, message, or time filters.
Archive-wide search links a known term to its source files and matching lines.
Downloads and general controls
Control
When to use it
WoV/SIM Download
Extract the available project for compatible engineering tools.
Trace Download
Download the captured trace files from the archive for further inspection; on-screen analyzer results are not included.
JSON Datamodel
Export normalized parsed data for comparison or downstream processing. This is not a complete copy of every archive file or history record.
New
Clear the current investigation and open another archive. A loaded archive requires confirmation before the page resets.
New tab
Open another tool instance for a second archive. Compare captures manually; the tabs do not merge their data.
Light mode
Switch the display theme. The selected theme is retained in this browser.
Downloads depend on the files actually present and recognized in the archive. Store exported evidence with its original archive and protect it as controller/customer data.
Troubleshooting and limits
Symptom
What to check
A section is missing or empty
Check archive type and contents. Process list and Accutest are KSS-only; many other sections require specific captured files.
A view is still loading
Allow first-open decompression and parsing to finish. Large histories can take longer than the initial archive import.
Log history has no rows
Restore source and severity selections, clear the Message field and time interval, and check whether the summary reports read errors. Ctrl+F highlights matches but does not hide rows.
A message is untranslated
Try an available Logbook language. Unknown keys retain raw text. HTTP deployments must include MessageDatabase/Standard.kxz; direct-file launches use the bundled embedded database.
Windows events fail to load
EVTX is supported even under .evt filenames. Genuine legacy EVT format is not supported; review the reported read error.
Events do not align in time
Review UTC display, original timestamps, KSS inferred dates, and controller clock differences. The tool does not correct clock offsets.
An export is unavailable
Check that the archive contains the required data. For POSLOG video, browser encoder support determines the available format; try GIF when appropriate.
Local-file behavior differs from HTTP
Try serving the complete tool directory over HTTP. Keep the shipped scripts, fonts, message database, and documentation assets together.
Data handling
Archive parsing runs in the browser. Some features may contact external services, such as firmware information or KUKA.Load; do not assume that every workflow is network-free. Review your organization's rules before sharing archives, screenshots, or exports.